

Demand Charges and EV Charging: How They Shape Financing
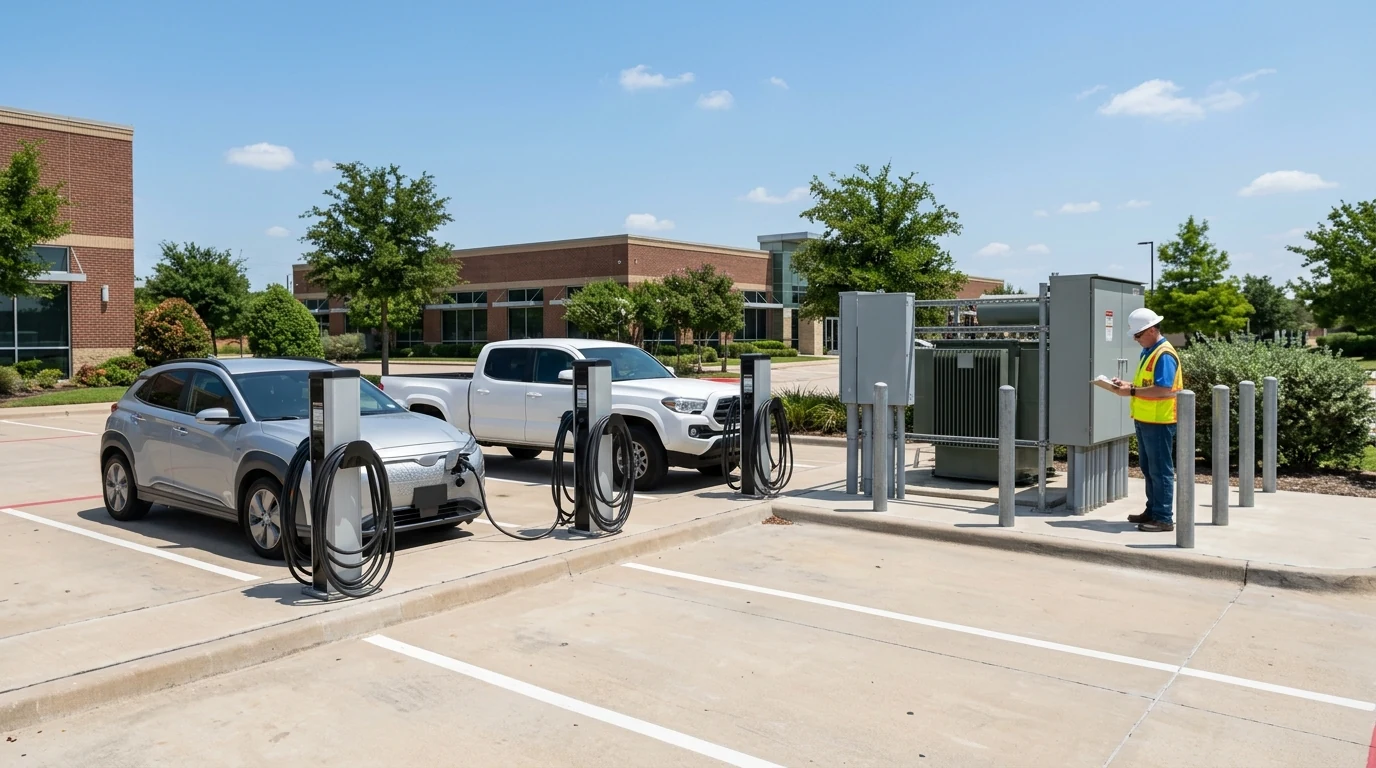
A demand charge does not care how much electricity a site uses. It bills the highest 15-minute average draw recorded during the billing period (DOE Alternative Fuels Data Center, 2026). One DC fast charging session can set that number for all thirty days.
This is the objection that stalls commercial EV charger deals, and it rarely surfaces during the quote. It surfaces two weeks later, after the site owner calls their utility account rep and hears a monthly figure nobody put in the proposal.
Most content on this topic stops at the definition. This guide covers what the operating cost looks like in published rate data, what moves it, and why every credible fix is a hardware line item. That is a separate question from the one-time capacity upgrade some sites need before energization, which is a utility-side gate on getting the site turned on at all, not a monthly bill.
> Key Takeaways
> - Demand charges are typically based on the highest 15-minute average use in a billing period, and DC fast charging equipment is more likely to trigger them than Level 1 or Level 2 (DOE AFDC, 2026).
> - In a 2019 NREL analysis of more than 7,500 US commercial and industrial rates, DC fast charging electricity cost ranged from less than $0.10 to more than $2.00 per kWh depending on station design and use (Muratori, Kontou & Eichman, Renewable and Sustainable Energy Reviews, 2019).
> - Low utilization, not high, is the punishing case. Cost falls rapidly as utilization rises, and at high utilization a rate with demand charges can beat one without.
> - Every credible fix (rate selection, load management, right-sized service, battery storage) is a capital item, which makes this a financing conversation, subject to approval and eligibility.
See how Eos Loan financing helps you close more projects
What is a demand charge, and why does EV charging trigger it?
A demand charge bills a commercial customer for peak power in kilowatts, separate from the kilowatt-hours consumed. Utilities typically set it from the highest 15-minute average use recorded over a billing period, and DC fast charging equipment is more likely to trigger one than Level 1 or Level 2 charging (DOE AFDC, 2026).
Think of it as two meters on one bill. One counts the energy that moved. The other watches how hard the site pulled at its single worst moment. A 150 kW dispenser at full output for a quarter of an hour writes a number the site pays for all month, even if that charger then sits idle.
Level 2 sites are not immune. One 7 kW wallbox will not move the needle at most commercial properties. Eight of them energizing at 8:00 a.m. when the delivery vans plug in absolutely will, because the meter reads total site draw, not per-port draw. Simultaneity creates the exposure, and simultaneity is a design choice.
For the capital-cost side of that same decision, see our breakdown of the equipment-tier difference between Level 2 and DC fast charging.
How much do demand charges actually cost?
The honest answer is that it depends almost entirely on which utility territory the site sits in. In 2019, an NREL analysis published in Renewable and Sustainable Energy Reviews looked at more than 7,500 US commercial and industrial electricity rates and found the cost of electricity for DC fast charging ranged from less than $0.10 to more than $2.00 per kWh depending on station design and use (Muratori, Kontou & Eichman, 2019).
Set that against the number most site owners have in their head. In May 2026, the US average retail price of electricity to the commercial sector was 13.54 cents per kWh, up from 12.93 cents a year earlier (EIA, Electric Power Monthly, Table 5.3, 2026). A charging site paying several times that is not being overcharged. It is paying a demand charge spread thinly over not much energy.
Dated tariff examples help more than a national average. In a February 2026 analysis of California public charging costs, Electric Era reported that San Diego Gas and Electric priced subscription capacity above 150 kW at $164.90 per 25 kW block as of January 1, 2026, roughly $6.60 per kW. Pacific Gas and Electric's Business EV rate uses $95.56 per 50 kW increment, about $1.91 per kW, in place of a traditional demand charge. Southern California Edison's commercial EV rates (EV-TOU-7, EV-TOU-8, EV-TOU-9) remain energy-only with no demand charges until the end of 2029 (Electric Era, February 2026).
Those three numbers sit in one state. Widen the map and the spread gets larger, not smaller, which is why a per-site rate review beats any national rule of thumb. For the capital side of a single site, see what a commercial EV charging install actually costs.
Why does low utilization make demand charges worse?
Here is the result that surprises most site owners. In that same 2019 NREL analysis, low utilization drove significantly higher electricity cost, particularly on rates that include demand charges, while cost decreased rapidly as utilization increased. For high-utilization stations, choosing a rate with demand charges can actually cost less than a rate without one (Muratori, Kontou & Eichman, 2019).
The mechanism is simple once you see it. A demand charge behaves like a fixed monthly cost divided by however many kilowatt-hours the site sells. Two sessions a month lands that cost on a tiny denominator. Two hundred sessions a month buries it in the per-kWh math.
This is where most charger proposals quietly break. A pro forma built on mature utilization understates the operating cost of the first twelve months, which is exactly when the owner decides whether the project was a mistake. Depot sites look better here because the vehicles are captive, one reason phased financing for a multi-site fleet depot rollout prices differently than public charging.
What I see from the lender's seat: the demand charge conversation almost never happens during the quote. It happens after the proposal is out, when the site owner calls their utility account rep with a nameplate kW number and gets a monthly estimate back. By then the installer is defending a price instead of explaining a design. Raise it yourself, in the proposal, with the mitigation already priced in.
What actually reduces demand charges at an EV charging site?
Three levers, roughly in order of cost: pick a better rate, cap the peak with load management, or buffer the peak with battery storage. The 2019 NREL analysis names two of these directly, citing preferential charging during off-peak hours and limiting multi-plug station power so that not all plugs can be used simultaneously at maximum power (Muratori, Kontou & Eichman, 2019).
1. Rate selection. Some utilities offer commercial EV rates that replace the traditional demand charge with a subscription block or waive it for a defined period, as the PG&E and SCE examples above show (Electric Era, February 2026). Availability and eligibility rules vary, so confirm with the serving utility rather than assuming.
2. Load management. Power sharing, scheduling, and a hard kW ceiling keep total site draw under a set number no matter how many drivers plug in at once. The second benefit gets undersold: staying inside the existing service capacity can avoid or delay a service upgrade, often the largest single line on a commercial quote.
3. Right-sizing the hardware. Two 100 kW dispensers sharing a 150 kW power cabinet produce a different billed peak than two standalone 150 kW units. Power level is not only a capital decision. It carries a monthly price tag for the life of the site.
Notice what these have in common. None is a discount you negotiate. Two are things you buy and install, and the third is paperwork that has to happen before the meter is set.
Add financing to your installs, talk to our team
Does battery storage lower the utility cost of an EV charging site?
A battery buffer lets the charger pull high power from the battery while the grid connection stays small, which cuts the billed peak. In one modeled California scenario, a NEVI-compliant 150 kW station ran roughly $47,500 per year in SDG&E subscription cost at 600 kW of grid capacity, versus roughly $27,700 per year for a 350 kW battery-backed design, a difference of about $20,000 a year (Electric Era, February 2026).
The physics fit the billing. The battery charges slowly at a low kW draw, then discharges fast when a vehicle arrives, so the meter never sees the spike. Those figures come from a vendor analysis with stated design assumptions, not a national rule, so treat the shape of the result as the takeaway rather than the exact dollars.
There's a second payoff that has nothing to do with the monthly bill. A smaller grid connection is a smaller ask of the utility, and a smaller ask often means a shorter service upgrade queue. For the business case on the storage side, see our guide to commercial battery storage financing, and for the combined scope, bundling EV charger and battery storage financing.
How do demand charges change the financed amount?
Read the list of fixes again and the pattern is hard to miss. A load management controller is hardware. Power-sharing dispensers are hardware. A right-sized service is electrical work. A battery cabinet is equipment. All of it is exactly the kind of scope a financed project absorbs without flinching.
The useful model is two levers. Demand charge exposure is roughly the peak kW added multiplied by the $/kW rate. The installer controls the first through design and influences the second through rate selection and timing. Both get decided before the contract is signed, which makes both sales conversations, not operations problems.
What we see across the Eos Loan partner base: when a commercial charging quote gets trimmed late over projected operating cost, the cuts follow a predictable order. Ports go first, then power level, then the controller. That is the exact reverse of the order that protects the site's monthly bill. It is an observed pattern in our partner base, not a survey result or a guarantee for any specific deal.
That inversion is the whole argument. A cash budget protects itself by deleting the cheapest-looking line, usually the controller, and the site pays for that deletion every month for a decade. A financed project keeps the mitigation in scope, and the payment difference between the two designs is far smaller than the operating-cost difference.
For installers, this is also the cleanest ticket-size story in the category. See our guide to financing a larger, better-engineered project and the practical setup in how to offer EV charger financing.
Eos Loan is a direct lender, not a marketplace or a broker, and funds the loan itself across battery energy storage, EV chargers, and water filtration. Financing can cover full project scope including hardware, controllers, electrical infrastructure, and labor, with flexible terms and no dealer fee, subject to approval and eligibility.
What should installers check before quoting a charging site?
Six checks turn the demand charge conversation at a commercial charging site from theoretical into a number the customer can act on. All of them fit inside the site walk or the week after it.
1. Pull twelve months of utility bills. You need the current rate schedule and the site's existing peak demand. Added load matters less than the peak the site already sets.
2. Ask whether the utility offers a commercial EV rate. Subscription and energy-only structures exist in some territories (Electric Era, February 2026). Confirm eligibility with the serving utility.
3. Model added peak kW at realistic simultaneity. Nameplate totals assume every port pulls maximum power at the same instant, which is a design failure, not a forecast.
4. Price load management as a standard line item. Treat it the way you treat conduit. An upsell gets cut; a standard inclusion does not.
5. Check whether a battery buffer shrinks the required service. If it does, it may shorten the utility upgrade timeline, often worth more to the customer than the monthly savings.
6. Check state policy. Minnesota requires each public utility selling electricity at retail to file an EV charging tariff containing a time-of-day or off-peak rate, and New York's Public Service Commission authorized a Demand Charge Rebate program providing operating cost relief for commercial EV charging customers (DOE AFDC state laws and incentives, 2026).
One more line belongs in the operating-cost column. The AFDC advises station owners to estimate average maintenance costs of up to $400 annually per charger, and cites California Energy Commission guidance that annual extended warranties for DC fast chargers can cost over $800 per charger per year (DOE AFDC, 2026). We cover that scope in our guide to warranty and maintenance plans.
For the underwriting basics behind all of this, start with our EV charger financing program for installers.
---
Offer your customers flexible financing on essential projects
Or call +1 833-989-3737 to talk through a financing program for your business.
---
{ question: "What is a demand charge on an EV charging bill?", answer: "A demand charge bills a commercial customer for peak power in kilowatts, separate from the kilowatt-hours used. Utilities typically base it on the highest 15-minute average use recorded over a billing period, and DC fast charging equipment is more likely to trigger one than Level 1 or Level 2 charging (DOE AFDC, 2026)." }, { question: "How much do demand charges add to DC fast charger operating cost?", answer: "It depends heavily on the utility territory. In a 2019 NREL analysis of more than 7,500 US commercial and industrial rates, DC fast charging electricity cost ranged from less than $0.10 to more than $2.00 per kWh depending on station design and use (Muratori, Kontou & Eichman, Renewable and Sustainable Energy Reviews, 2019). Low utilization drives the high end." }, { question: "Can load management reduce EV charging demand charges?", answer: "Yes. Load management shares available capacity across sessions so total site draw stays under a set kW ceiling. A 2019 NREL analysis names limiting multi-plug station power, so not all plugs draw maximum power simultaneously, as a cost-saving lever alongside off-peak charging (Muratori, Kontou & Eichman, Renewable and Sustainable Energy Reviews, 2019)." }, { question: "Do any utilities offer EV rates without demand charges?", answer: "Some do. A February 2026 Electric Era analysis reported that PG&E's Business EV rate uses subscription blocks of $95.56 per 50 kW instead of a traditional demand charge, and that SCE's commercial EV rates remain energy-only with no demand charges until the end of 2029. Confirm eligibility with your serving utility." }, { question: "Can demand-charge mitigation equipment be financed?", answer: "Yes. Load management hardware, power-sharing dispensers, right-sized electrical infrastructure, and battery energy storage can all sit inside a financed project scope with a direct lender. Eos Loan funds full project scope with flexible terms and no dealer fee, subject to approval and eligibility." } ]} />Financing the fix instead of fearing the bill
A demand charge is not a reason to build a smaller charging site. It is a design constraint with a price, and that price is set by decisions the installer makes before the contract is signed. Here is what to carry into the next commercial charging conversation:
- Demand charges bill peak power set by a single 15-minute window, not total energy used.
- The cost swing across territories is enormous, from under $0.10 to over $2.00 per kWh depending on design and use.
- Low utilization is the punishing case, which makes year one the hardest year, not the easiest.
- Every credible mitigation is a capital item you buy, install, and can finance.
- Cash budgets delete the controller first; a financed project keeps it in scope.
Quoting a commercial charging site this quarter? Become an Eos Loan financing partner and put the mitigation in the proposal before the utility puts it in the customer's inbox.
---
About the author: Eduardo Donadi is the CEO of Eos Loan, a direct lender specializing in financing for essential projects including battery energy storage, EV chargers, and water filtration. He works directly with commercial electrical contractors and EV charging installers on project scope and financing structure, from a single Level 2 wallbox to a battery-buffered DC fast charging site.
---
Sources
1. US Department of Energy, Alternative Fuels Data Center. "Electric Vehicle Charging Infrastructure Maintenance and Operation." https://afdc.energy.gov/fuels/electricity-infrastructure-maintenance-and-operation Retrieved 2026-05-18.
2. Muratori, M., Kontou, E., Eichman, J. "Electricity Rates for Electric Vehicle Direct Current Fast Charging in the United States." Renewable and Sustainable Energy Reviews, 2019. https://www.osti.gov/pages/biblio/1543251 Retrieved 2026-05-18.
3. US Energy Information Administration. "Electric Power Monthly, Table 5.3: Average Price of Electricity to Ultimate Customers by End-Use Sector." https://www.eia.gov/electricity/monthly/epm_table_grapher.php?t=epmt_5_3 Retrieved 2026-05-18.
4. Electric Era. "California Public EV Charging Costs and Demand Charges." February 2026. https://electricera.tech/resources/california-public-ev-charging-costs-demand-charges Retrieved 2026-05-18.
5. US Department of Energy, Alternative Fuels Data Center. "Electricity Laws and Incentives." https://afdc.energy.gov/fuels/laws/ELEC Retrieved 2026-05-18.