

How to Calculate the Payback Period on a Financed EV Charger
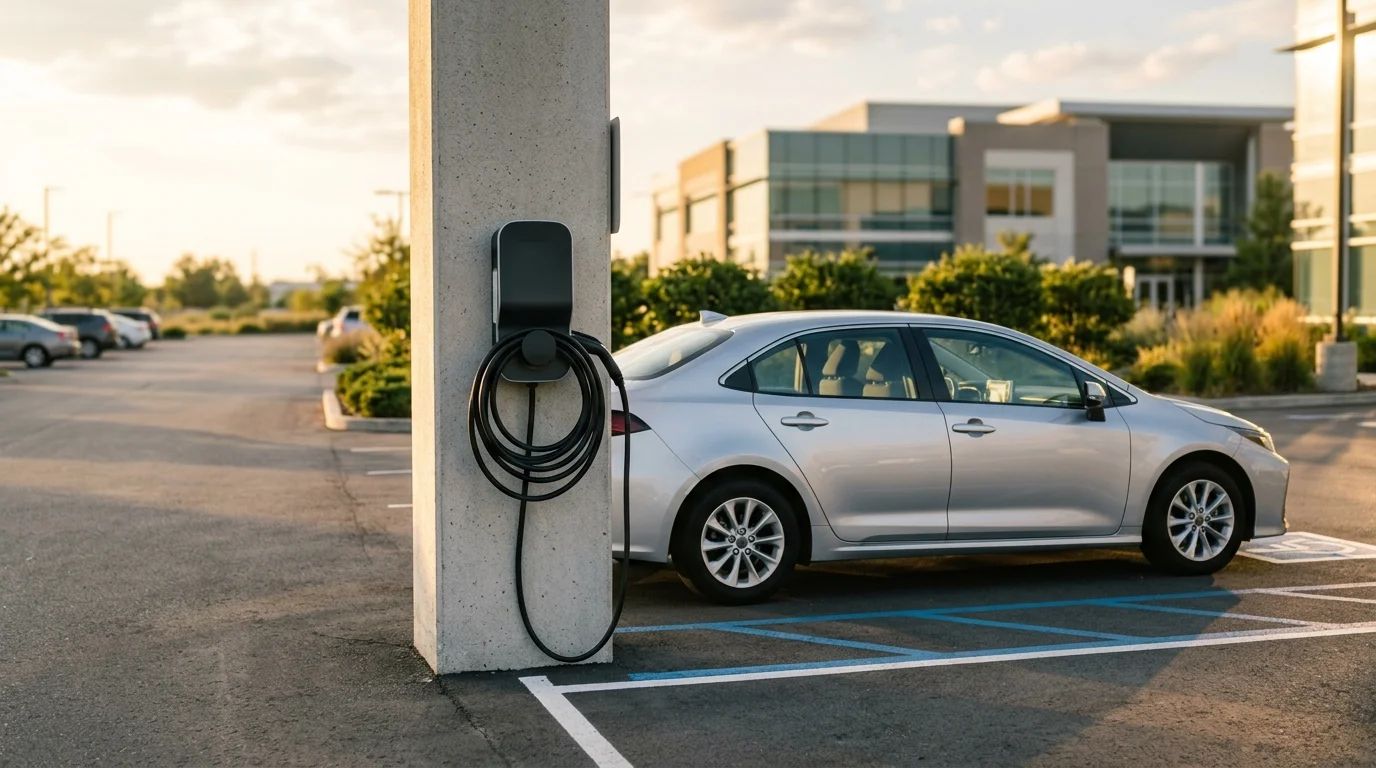
EV charger payback period is your net project cost divided by your annual net operating return, meaning the charging revenue left over after electricity, maintenance, network fees, and demand charges. Get one hardware-and-install quote and you can run this math in about ten minutes. The answer depends mostly on how many sessions each port delivers, not on the sticker price.
Most property managers, employers, and retail operators never run the numbers. They receive a quote, hear that "incentives may be available," and never see a clear line showing when the project pays for itself. That gap is one reason EV charging decisions stall.
This guide gives you the formula, a worked example with a 4-port Level 2 station, the three inputs that move the result most, and a federal tax credit deadline that changes the numerator for any project finishing now.
> Key Takeaways
> - Payback = net project cost / annual net operating return. In our 4-port example, that ratio ranges from about 2 to 15 years.
> - Sessions per port move the result more than hardware price does.
> - The Section 30C credit cannot be claimed for property placed in service after June 30, 2026 (IRS Instructions for Form 8911, revised December 2025).
Talk to our team about financing your EV charging project
What Is EV Charger Payback Period, and How Do You Calculate It?
EV charger payback period is the number of years a charging station's own operating economics take to return its net cost. The formula is simple: Payback (years) = Net Project Cost After Incentives / Annual Net Operating Return. Net cost is what you pay after any credits or rebates that actually apply to your project. Net operating return is what the station earns each year after its running costs.
"Annual net operating return" is the part most quotes leave out. It equals charging revenue (or avoided fuel cost, if you run a fleet depot or a staff charging program) minus electricity, network or software fees, maintenance, and any demand charges your electric provider bills on peak power draw. Leave out one of those lines and the payback number looks better than it should.
!A row of commercial EV charging stations with vehicles plugged in under bright daylight.
The method has two numbers and one division. The hard part is getting honest inputs for both sides, starting with the cost side, which is what the next section covers.
What Does an EV Charger Cost, and How Does That Affect Payback?
Quotes for commercial Level 2 charging are usually expressed per port. In 2026, one installer guide puts a commercial Level 2 station at about $3,000 to $12,000 per port installed, with the total moving with trenching distance, switchgear, and any electrical service upgrade (GreenLancer, "A Guide to Commercial Electric Vehicle Charging Stations", 2026). Treat that range as a starting point and replace it with your own quote.
For the worked example in this guide, we use $10,000 per port, which gives an installed cost of $40,000 for four ports. Multi-port sites often save a little per port on shared trenching and electrical work, but each dispenser still adds hardware and labor. Charger tier also changes the math. For a comparison of cost and use cases, see our breakdown of the cost difference between Level 2 and DC fast chargers.
How Does the Section 30C Credit Change Your Net Cost?
As of the December 2025 revision of the IRS instructions, the federal Section 30C credit covers 6% of the cost of qualifying alternative fuel refueling property, or 30% when prevailing wage and apprenticeship requirements are met, with a limit of $100,000 per item of property (IRS Instructions for Form 8911, revised December 2025). The same instructions say you cannot claim the credit for property placed in service after June 30, 2026.
That cutoff changes the numerator for any project finishing now. "Placed in service" means the station is complete and operating, not just contracted or under construction. A project that goes live after June 30, 2026 should enter the formula with no Section 30C credit. Some state or local programs may still apply, so check each one separately.
For the worked example below, we assume no Section 30C credit, which keeps net cost equal to installed cost. If you are evaluating a project that was placed in service before the deadline, confirm eligibility with a qualified tax advisor before subtracting any credit. For a view of what other programs might stack, see our guide to state-level EV charger incentives.
How Do You Estimate Annual Charging Revenue or Savings?
Annual revenue equals sessions per port per day, times ports, times 365 days, times kWh delivered per session, times the price you charge per kWh. Electricity cost uses the same kWh figure at what you pay per kWh. The difference is your energy margin. If you run a fleet depot or workplace program instead of public pay-to-charge, substitute avoided fuel cost for price, and the rest of the formula works the same way.
Sessions drive the answer more than hardware does. A port that sits idle most of the day cannot cover a fixed cost base, no matter how good the charger is. That is why the method asks you for a session count, not a national utilization average. If you already have traffic data, such as daily visitor counts, employee headcount, or fleet vehicle count, use it to estimate session volume. Your own site's draw is a better input than any industry average.
The worked example in the next section uses these illustrative inputs. They are assumptions for the method, not Eos Loan pricing and not a quote for any site.
- Price charged: $0.35 per kWh
- Electricity cost: $0.15 per kWh
- Energy margin: $0.20 per kWh
- Energy delivered per session: 10 kWh
- Fixed annual costs for the site: $9,000 (network fees $1,600, maintenance $2,000, demand charge allowance $5,400)
- Payback period = net cost after incentives / annual net operating return. Confirm each incentive's eligibility before you subtract it.
- Sessions per port drive the result more than hardware price. Test a low case before you commit.
- Demand charges and network fees belong in the denominator, not in a footnote.
- The Section 30C credit requires placement in service on or before June 30, 2026, and cannot be assumed for later projects.
- A worked example is a method, not a promise. Run it with your own site's numbers.
How Do Demand Charges Change the Payback Math?
Demand charges bill the highest peak kilowatt draw in a billing period, not just the kilowatt-hours your station consumes. A single high-power session, or several ports starting at the same moment, can set a demand charge that applies for the entire month regardless of how many sessions follow. That makes demand charges a fixed-style cost that does not shrink when traffic is light.
For the full mechanics of how demand charges are billed and how they reshape a financed charging project, read our deep dive on demand charges and EV charging financing. For this formula, the key point is simple: demand charges sit inside your operating costs, so they reduce the denominator before you divide. Load management, which staggers ports so they do not all peak together, can lower that line item.
See what financing could look like for your site
Worked Example: Payback on a 4-Port Level 2 Station
Here is one complete calculation, with every line shown so you can swap in your own numbers. A property manager evaluates four Level 2 ports at a mixed-use retail site. This example is illustrative and uses the assumptions listed above.
Step 1, installed cost. Four ports at $10,000 each equals $40,000. No Section 30C credit is applied because the project is assumed to be placed in service after June 30, 2026. Net cost is $40,000.
Step 2, annual energy volume. At 6 sessions per port per day, four ports deliver 6 × 4 × 365 = 8,760 sessions per year. At 10 kWh per session, that is 87,600 kWh.
Step 3, revenue and energy cost. Revenue is 87,600 kWh × $0.35 = $30,660. Electricity is 87,600 kWh × $0.15 = $13,140. Energy margin is $17,520.
Step 4, fixed costs. Network fees of $1,600, maintenance of $2,000, and a demand charge allowance of $5,400 total $9,000 per year.
Step 5, net operating return and division. $17,520 minus $9,000 equals $8,520 per year. Payback is $40,000 / $8,520, or about 4.7 years.
!A property manager reviewing figures on a tablet near a commercial EV charging station in daylight.
The chart below compares the installed cost with the annual dollar figures from the base case.
The base case lands at roughly 4.7 years. Notice how much the result depends on one input you can control: sessions. The next section shows what happens when the same station runs busier or quieter.
How Sensitive Is Payback to Sessions per Port?
Payback does not move in a straight line with traffic, because the fixed costs stay the same while the energy margin grows with every session. Using the same four ports, $40,000 cost, $0.20 energy margin, and $9,000 fixed annual costs, the payback changes like this:
| Sessions per port per day | Annual net return | Payback (years) |
|---|---|---|
| 4 | $2,680 | 14.9 |
| 5 | $5,600 | 7.1 |
| 6 (base case) | $8,520 | 4.7 |
| 7 | $11,440 | 3.5 |
| 8 | $14,360 | 2.8 |
| 9 | $17,280 | 2.3 |
Two lessons follow from the table. First, a station that falls from six sessions to four more than triples its payback. Second, at three sessions per port per day, the fixed costs exceed the energy margin, so the example never pays back at all. A site with uncertain traffic should test the low case before it commits to a build.
Where the base-case revenue goes is the last piece of the picture. The donut below splits the $30,660 of annual gross revenue across the operating lines and the net return.
Electricity is the largest line item in this example, which is why the energy margin deserves the most careful input. Demand charges are the second-largest cost and the one that is easiest to leave out of a quick estimate.
How Do You Stress-Test the Result Before You Approve the Spend?
Run three cases before anyone signs a purchase order: a low case, a base case, and a high case. Set the low case at the session count you would be comfortable with if the first year is slow. If the project still clears your hurdle in the low case, the payback is more likely to hold. If it fails in the low case, the decision depends on traffic you have not yet proven.
Keep the fixed costs honest, too. Ask the electric provider for the demand charge schedule that applies to the meter, and ask the installer or network provider for written fee terms. Those two lines are easy to underestimate and hard to recover later.
Frequently Asked Questions
question: "How long does it take for an EV charger to pay for itself?",
answer: "It depends on sessions per port, electricity cost, the price you charge, and fixed costs. In the 4-port example in this guide, payback ranges from about 2.3 years at 9 sessions per port per day to about 14.9 years at 4 sessions. Run the formula with your own quote and session data rather than relying on an average."
},
{
question: "Does the Section 30C tax credit affect payback period?",
answer: "It can, but only if the property was placed in service on or before June 30, 2026. The IRS instructions set the credit at 6%, or 30% when prevailing wage and apprenticeship requirements are met, capped at $100,000 per item of property (IRS Instructions for Form 8911, revised December 2025). Confirm eligibility with a qualified tax advisor."
},
{
question: "Should demand charges be included in the payback math?",
answer: "Yes. Demand charges are a cost of operating the station, so they reduce annual net operating return before you divide. In the worked example, leaving out the $5,400 annual demand charge allowance would shrink payback from roughly 4.7 years to about 2.9 years, a result the site would not deliver. Ask your electric provider for the schedule that applies to your meter."
},
{
question: "What if I am not sure how many sessions my site will get?",
answer: "Run low, base, and high session scenarios and check whether the project clears your hurdle in the low case. The sensitivity table in this guide shows how quickly payback stretches when session counts fall, so the low case is the one to test first."
}
]} />
Run the Formula Before You Approve the Spend
The formula does not change: net project cost, divided by annual net operating return. Everything else in this guide is a set of honest inputs for both sides of that division. Before you approve a charging station quote, check these points:
Work through the formula with your own quote and traffic estimate. For the broader financing picture, start with our full guide to EV charger financing for installers, or compare financing, leasing, and paying cash and commercial EV charging station financing. Sites considering a convenience-store or gas-station retrofit can also read our guide to EV charger financing for gas stations and convenience stores.
Ask about flexible terms for your EV charging project
Or call +1 833-989-3737 to talk through financing for your EV charging project.
---
About the author: Eduardo Donadi is the CEO of Eos Loan, a direct lender that finances essential projects, including battery energy storage, EV chargers, and water filtration. He writes about how property managers, employers, and site operators can test a charging project's economics before committing capital.
---
Sources
1. Internal Revenue Service. "Instructions for Form 8911 (Alternative Fuel Vehicle Refueling Property Credit)." Revised December 2025. https://www.irs.gov/instructions/i8911 Retrieved 2026-10-06.
2. GreenLancer. "A Guide to Commercial Electric Vehicle Charging Stations." 2026. https://www.greenlancer.com/post/guide-commercial-electric-vehicle-charging-stations Retrieved 2026-10-06.
All worked-example figures in this guide (prices, electricity cost, session counts, fixed costs, and demand charge allowance) are illustrative assumptions for the calculation method. They are not market statistics, Eos Loan pricing, or a quote for any site.